

Easter 2021 Charting Blog
- StrayDog

- Apr 5, 2021
- 4 min read
Hey reader - 14 instruments on 19 charts are here.
Too much for you? Leave in peace, but IF you do LIKE charts, THEN stay a bit and take a look.

This Charting Blog is to show some USUAL things that you can see on many instruments, patterns and behavior usable on smaller timeframes as well. So, not to PREDICT direction, but to NOTE thigs and to provoke YOU to CHART. Put YOUR lines, trendlines and fibs and observe HOW will market react on it, since not all markets are the same. Breaks and tests, breaks without tests, reactions, false breaks, ranges, channels...
Charts of Indices, US Stocks, German Stocks and Oil incoming... /click on chart for full screen view/
Indices
NDX Daily
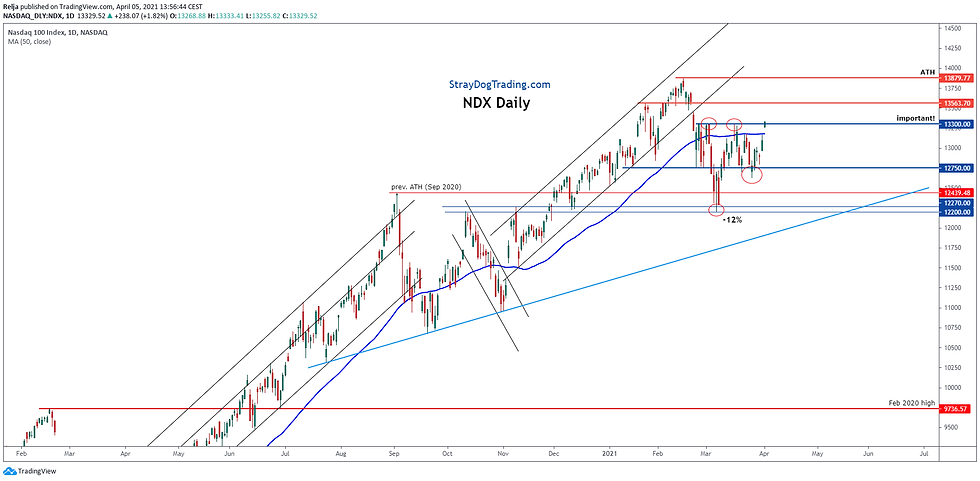
After making a -12% correction, NDX was stuck in the 12,750 - 13,300 for a while. Last Friday it made a gap and go over DMA50. Holding above 13,300 can clear a way to ATH, BUT THEY need to hold. Alternative is making a bear trap, just like the last time below 12,750 - and using DMA50 as Support. Bears below 12,750 and especially below 12,200.
RUT Daily

Higher high with clear bearish divergence (on MACD and RSI), and -11% move.
Higher lows. Above DMA50 again.
SPX Daily
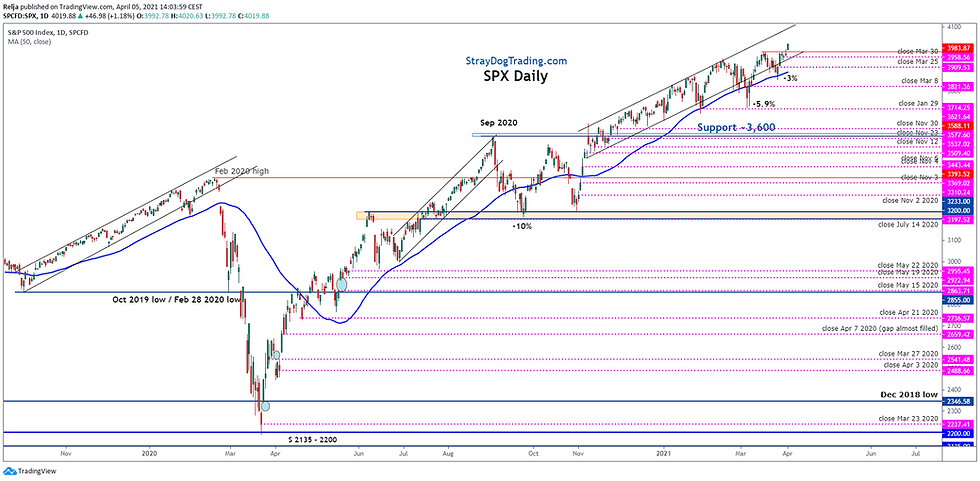
"Don't worry be happy" chart. No real break of the last narrow upsloping channel, like the previous two times.
DMA 50 HOLDING. Many unfilled gaps left behind. Strong Friday and a new ATH.
Thought:
NDX and RUT certainly look more appealing to buying now, we have previous ATHs as targets, while SPX just melts up. Watch for correlations, since it seems that money goes to tech again.
DAX Monthly

This simple chart is there to illustrate the size of the swings, how much time it takes to make a REAL break, that we have one now, "market memory"...
DAX Daily - zooming in from October 2020

Channel, unfilled gaps, S/R zone at 14,200.
Important levels 14,800 and especially 14,420.
Below 14,200: 13,700; 13,300; 13,000.
Above Friday high - we can draw trendlines and make estimates. Break above 14,200 - easy to be bullish, BTD environment. Now, after 1000 points move - we need to observe PA and to choose which dip you are going to buy, to "carry on" those two unfilled gaps below, and untested breakout point, and to day-trade, since swing entries are gone. For swing entry you need a pullback, OR failure below support. Hit and run now.
What can DAX do? Well, check previous Monthly chart and swing sizes.
US STOCKS
Amazon Weekly

Left to right:
Rally - 2018 highs - pullback - SPRING below support.
FIRST test of 2018 highs = reaction, down.
FALSE break next, Corona selloff.
"Corona low" - another spring below Support.
Rally, breakout(s). No breakout test.
Balancing since July 2020.
Facebook Daily

Holding below or above the Earnings gaps.
Big gaps are NOT easy to fill, and will provide good S/R references for a long time.
DMA200 + another reference, like GAP or horizontal Support = CONFLUENCE.
Springs and Upthrusts.
Google Weekly

While NDX had a 12% correction, Google didn't budge at all, it remained in the balance, very similar size like the prior one. WMA200 together with prior Support at "Corona low".
Google Daily

If we zoom a bit - you can see HOLDING above the gap, and DMA200 touch on Sep 2020 low. Example how stocks use Earnings gaps.
Microsoft Weekly

Left to right:
Bull-flag breakout.
Range, spring below, up.
Flat base / rectangle / balance breakout, parabolic move higher.
"Parabolic moves tends to retrace" - this one retraced completely, due to Corona selloff.
Corona low at prior Support, and ORIGIN of the parabolic move.
Higher lows and trendline supportive next.
Tesla Weekly

Example of momentum stock and breakouts.
Breaks above prior resistances, break of the triangle.
Pullback and wicks below 38.2.
HIGH BETA stocks will not behave like slower ones, so DO NOT expect the same to happen with slow stocks. Slow stocks can base for years, just to make a FALSE break. Know the instrument, prior to making any kind of conclusions, and ADJUST your expectations.
GERMAN STOCKS
Infineon Monthly
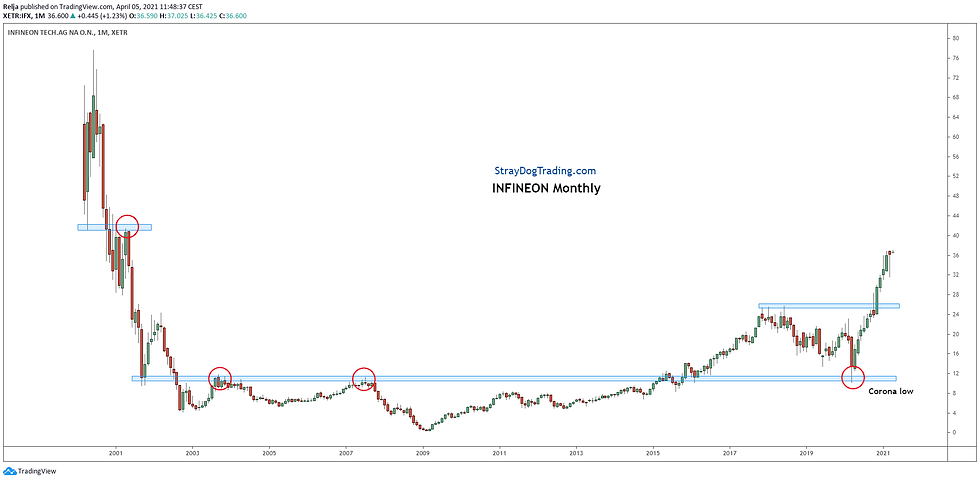
Support becoming Resistance, then back to Support.
It took 15 years to break above that resistance, which was tested 4 years later as "Corona low". Time. Not all breakouts are the same. This is not Tesla, and looks much more (but again - NOT the same) like Twitter chart.
Bayer Weekly

Left to right:
Multi-year balance breakout, tested with SHALLOW pullback, rally.
Drop below WMA50 -> back-test -> down. Down trend next.
Unfilled gap from 2018.
Channel, first tests of channel boundaries.
Lower lows, lower highs. False breaks down and up.
Allianz Weekly

Some great examples of "market memory" and Axis line.
Still below the high made prior to Corona selloff.
"Corona low" neatly landed at prior Support, with a small spring below [classic].
Same thing present on many charts showed here.
SAP Weekly and Daily

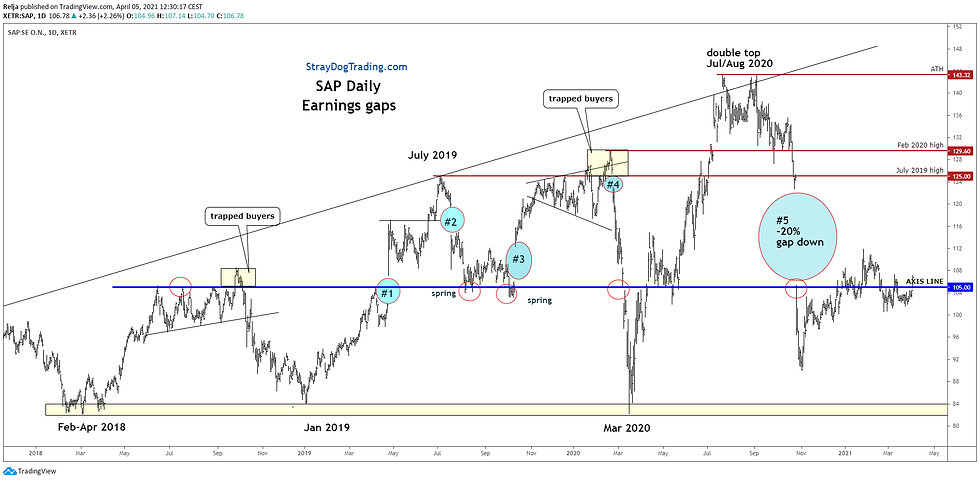
Great examples of false breakouts and trapped buyers.
Double top at ATH.
Earnings gaps and how LONG they were left unfilled.
Axis line.
BASF Monthly only horizontals

Upthrust as ATH.
Market "memory" and reactions to S/R zones.
Swing Low that was not a random one, like we can see on the next chart.
BASF channel and three usable fibs

CONFLUENCE of channel and halfback.
Three usable fibs - many more on smaller timeframes!
DRAW FIBS...
Finally … Oil
CL_F Monthly

Great example of S/R levels and zones, false and real breaks, trendlines...

Think what can YOU conclude and learn from charts showed here. How market breaks a range, how often it makes false breaks as bear or bull traps. How it reacts to horizontal levels, to channels, to trendlines, fibs, gaps, and classic moving averages (like Simple MA 50 and 200). Since it will do that AGAIN, and AGAIN and AGAIN. Many reactions and behavior will be the same on smaller timeframes.
What is important and crucial to understand - when you have your lines placed (levels, zones, trendlines, fibs...), you wait for the opportunity, but when it comes, YOU NEED to react.
There is no try.
In short term trading it is very important to properly understand context heading into every day, to know from which side wind is blowing - who has the short term control, and which side will be forced to liquidate IF and WHEN market hold above or below a certain level. What is the level of volatility, what can we expect from any particular day, what market already done in premarket session, what possible setups can be available, and so on... the things that we constantly learn in the DAILY DOSE OF DAX.
Cheers, Relja a.k.a. StrayDog


Comments