Chart #1 - DAX Futures Weekly

ECB and FED events are in the rear window now, market got stimulus - but not exactly what market wanted - punch bowl was NOT filled to the lid. Next FOMC meeting comes in 38 days - on October 30th. Looking at CME FedWatch Tool, currently there is 100% chance of US Federal Fund Rate to remain the same. Those numbers are prone to changes. Earnings season will begin in 3 weeks, and US-China trade relationship still has the potential to rock the markets, as we saw on Friday - when Chinese delegation cancelled planned visit to USA.
Chart #2 - ES Weekly and zoom on Daily

On Weekly chart - ES (SPX) is still inside megaphone structure, on Daily chart inside the range. Resistance is ATH level, as well as upsloping trend-line, which now comes around 3040-50. We already had the first test of this trendline - and that was easier to predict than upcoming moves. First support is around 2980 and then 2942 as top of previous range. We didn't get the backtest of the 2942, so that is one of the scenarios. Those are inflection points. Bulls need > ATH, bears need < 2980 for start. Plenty of daily closes around 3000-3010. If you have Market Profile - look at HVNs also (High Volume Nodes).
Chart #3 - Cash Index gaps on DAX and SPX

DAX has a gap above the current range on 12,676 and closest one below is on 12,269 - while SPX has a unfilled gap close to ATH level at 3025.9 and first to the downside on 2953.6. Numbers are rounded. Cash chart as an Index chart is important, as these gaps can serve as a magnet, if price goes toward them. Because of that, traders use them as targets, in combination with S/R levels and zones. Last week, DAX closed mostly around 12,460 and 12,360 areas.
Chart #4 - DAX Futures Daily

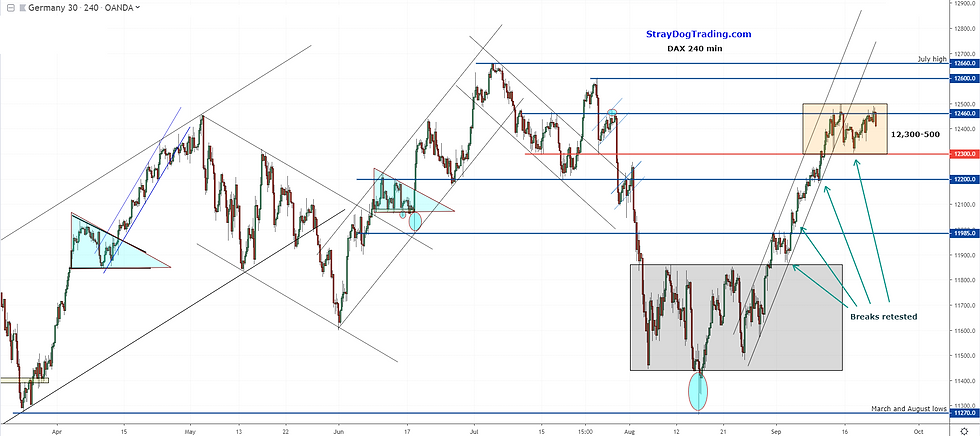
Current range on DAX is 12,300-500 and entire range is still below crossroad of various trend-lines.
Chart #5 - DAX Daily and 240 min to observe bearish divergence

Pretty normal to see at this point, we have bearish divergence on DAX. One way for market to leave the "overbought" condition after a large up leg is just to make a range, chill out in it for a while, and then continue upwards. Bearish divergence here is a sign of momentum fading. On the other hand - no serious sellers for now.
Chart #6 - DAX CFD 240 min

Familiar chart with levels. LTF (Large timeframe) level 12,460 was decent resistance so far, as price just pierced it a few times without follow-through. However, if this level breaks, as well as 12,500 which is top edge of a current range - there is nothing much of a resistance up to next LTF levels of 12,600 and 12,660. Level around 12,300 remains bull/bear level. Bearish case requires breakdown of 12,300 and then we can find targets on this chart, or Chart #3 with Cash Index gaps, or make a fib retracement of this entire up leg, and see where we have alignment with other references. Strong downside momentum could fill all those gaps up to 11,839.
Conclusion:
We had choppy week on DAX and SPX, and both indices remained in the range. This was the test of patience for traders, and choppy PA offered limited reward for us. Markets remained resilient, and traders need chances for asymmetric risk-reward. When you "feel" that it is hard to get even a +2R trade, then good option is to wait for YOUR favourite setups / patterns to show, and then to react and not overstay in the trade. But, where will these markets go? Sometimes answering this question can be very tricky. Like now. Sometimes it is easier to predict markets next move. In next week, we will have good potential for news driven moves.
Mario Draghi will speak on Monday and Thursday, FED Chair Powell will speak on Thursday also, and various FOMC Members will speak every day next week, except on Tuesday. So, that could be the catalyst to kick markets out of their ranges. IMO - stay open to both scenarios, upside continuation, or breaking down the current ranges. Inflection points and gaps can be good targets.
As I often say to the clients of DAILY DOSE OF DAX Service: Remember that market information, like divergence, or single daily candle bullish or bearish appearance, is just one piece of the puzzle, and to apply context to your every decision. Bias can cloud your mind, so if bullish, you will buy top of the range expecting breakout, or if bearish sell bottom of the range "sensing" the breakdown. Usually only to see markets go the opposite way. The only good odd scenario for next week is likely markets will leave their ranges, and again, such a break can be false or real. Go day by day. Know the context, levels, zones, references of importance, and keep bigger picture in mind, not just 1 or 5 minute chart.
Cheers, StrayDog
Commenti